In the ever-evolving landscape of IT infrastructure management, harnessing the power of logs has become paramount. Enter SolarWinds Log Analyzer, a potent tool in the arsenal of IT professionals. In this deep dive, we’ll uncover the intricacies of SolarWinds Log Analyzer, exploring its multifaceted features, the myriad benefits it offers, practical use cases, and the nuances of licensing.

Before we plunge into the depths of SolarWinds Log Analyzer, let’s first understand why log analysis is the cornerstone of modern IT operations.
Logs are akin to the DNA of your IT environment. They capture every event, every action, and every anomaly that occurs within your systems and applications. Analyzing this data is not just an option; it’s a necessity.
Log analysis enables organizations to move from a reactive to a proactive stance. Instead of waiting for issues to manifest, IT teams can identify potential problems, security threats, and performance bottlenecks before they cause significant disruptions
In a world of stringent regulations, log analysis plays a pivotal role in compliance management. It provides an audit trail that proves adherence to security and data protection standards.
The licensed SolarWinds Log Analyzer excels at real-time log collection. It can ingest logs from various sources, including servers, network devices, applications, and security appliances. This real-time capability ensures that IT teams are aware of events as they unfold.
Logs come in different formats and structures. SolarWinds Log Analyzer’s log parsing and normalization capabilities make sense of this data chaos. It converts raw log data into a standardized format for easy analysis.
The sheer volume of log data can be overwhelming. The licensed SolarWinds Log Analyzer provides powerful search and filtering tools, allowing IT professionals to pinpoint specific events or patterns quickly. Whether it’s a security incident or a performance anomaly, finding the needle in the haystack becomes a breeze.
Proactive alerting is a key feature of SolarWinds Log Analyzer. It can trigger alerts based on predefined criteria, such as specific log patterns or critical events. These alerts can be configured to notify IT staff in real-time, ensuring swift action when needed.
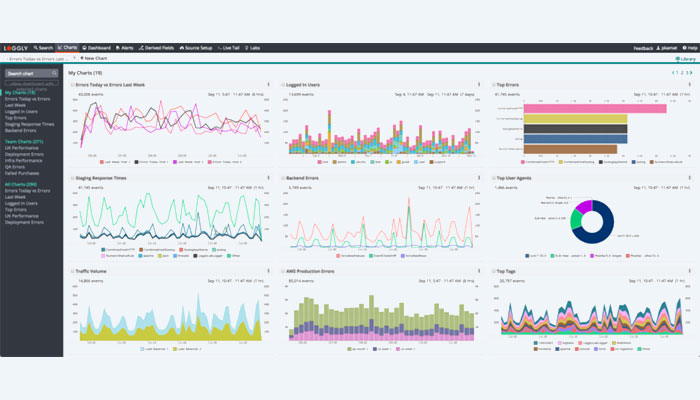
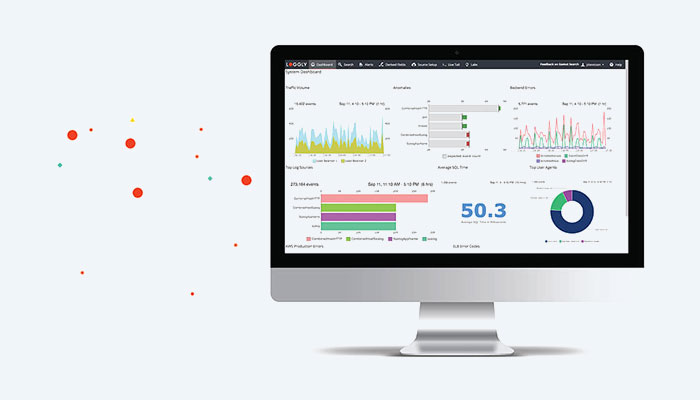
The licensed SolarWinds Log Analyzer doesn’t stop at raw log data. It offers visualization tools to turn logs into actionable insights. Dashboards and graphs provide a visual representation of log trends, making it easier to spot anomalies or trends.
Log Analyzer is your silent sentinel, tirelessly watching over your network. By continuously monitoring logs, it can detect security breaches, unauthorized access attempts, and other suspicious activities in real-time. This proactive approach can thwart cyber threats before they escalate.
IT professionals know the frustration of users reporting problems that seem to vanish by the time they investigate. Log Analyzer eliminates the guesswork. It captures the data needed to diagnose and resolve issues promptly.
The labyrinth of compliance requirements can be daunting. Log Analyzer simplifies compliance management by providing a comprehensive audit trail. Whether it’s GDPR, HIPAA, or PCI DSS, you’ll have the evidence needed to demonstrate compliance.
Time is money, and SolarWinds Log Analyzer saves both. By automating log collection and analysis, it reduces the time required for manual tasks. Faster troubleshooting means less downtime, translating to cost savings.
As your organization grows, so does the volume of log data. SolarWinds Log Analyzer scales with your needs, ensuring that you can maintain effective log management regardless of your organization’s size.
The battle against cyber threats is unceasing. Log Analyzer acts as your vigilant guardian, rapidly identifying suspicious activity patterns and triggering alerts. It provides the data needed to investigate and respond to security incidents swiftly.
The “it’s slow” or “it’s not working” complaints are a staple in IT. Log Analyzer transforms these vague grievances into actionable insights. By analyzing logs, it helps IT teams pinpoint the root cause of network or application issues, reducing downtime and frustration.
The web of compliance regulations can ensnare the unprepared. Log Analyzer simplifies compliance by collecting and organizing the necessary data for audits. From access logs to security events, it’s your compliance ally.
To keep your IT infrastructure running smoothly, you need to understand its performance. Log Analyzer provides visibility into system and application performance, helping IT teams identify bottlenecks and optimize resource allocation.
In the aftermath of a security incident or data breach, forensics and investigation are critical. Log Analyzer preserves a detailed record of events, enabling thorough forensic analysis and investigation.
The licensed SolarWinds Log Analyzer offers licensing tiers to suit organizations of all sizes. Whether you’re a small business or an enterprise, there’s a licensing tier that fits your needs.
Choose the licensing model that aligns with your budget and preferences. SolarWinds Log Analyzer offers both perpetual and subscription options, providing flexibility in your investment.
As your log management needs evolve, SolarWinds Log Analyzer allows for scalability and easy upgrades. You can adapt to changing requirements without hassle.
Before embarking on your log analysis journey, ensure that your system meets the prerequisites for SolarWinds Log Analyzer.
Walk through the installation process step by step, guiding users on how to set up SolarWinds Log Analyzer successfully.
Once installed, learn how to perform the initial configuration to tailor the software to your log management needs.
With SolarWinds Log Analyzer in place, it’s time to delve deeper into configuration and optimization.
Discover how to add various log sources, from servers to network devices, ensuring that all critical data is captured.
Log data comes in diverse formats. Configure log parsing rules to normalize and standardize incoming log data for efficient analysis.
Set up custom alerts and notifications to keep your team informed of critical events in real-time. Fine-tune alert criteria to focus on what matters most.
Define data retention policies to manage the storage of log data effectively. Ensure compliance with retention requirements while optimizing storage resources.
The licensed SolarWinds Log Analyzer is a powerful tool that can significantly aid network managers in their daily operations and network management tasks. Here’s how SolarWinds Log Analyzer can help network managers:
To conclude our journey into SolarWinds Log Analyzer, let’s consider some valuable tips for unleashing its full potential.
Develop log data retention strategies that align with your organization’s compliance and operational needs. Determine how long you need to retain log data and configure Log Analyzer accordingly.
SolarWinds offers a suite of IT management tools. Explore how Log Analyzer can integrate with other SolarWinds products, such as Network Performance Monitor or Security Event Manager, to create a unified IT management ecosystem.
Continuous monitoring is the key to early detection. Regularly review log data and adjust alerting thresholds as needed to ensure proactive issue resolution.
Invest in training and skill development for your IT team. Equip them with the knowledge and expertise needed to leverage Log Analyzer effectively.
In an era where data drives decisions and security is paramount, SolarWinds Log Analyzer stands as a stalwart ally for IT professionals. This article has taken you on a journey through its features, benefits, use cases, and licensing, highlighting its role as the guardian of your IT environment.
