In the ever-evolving landscape of IT infrastructure management, efficient storage resource monitoring has become a critical necessity. SolarWinds SRM (Storage Resource Monitor) stands as a formidable solution in this realm. This article delves deep into SolarWinds SRM, exploring its features, benefits, use cases, licensing options, and more.

Introduction to SolarWinds SRM
The licensed SolarWinds SRM is a comprehensive tool designed to help IT professionals monitor and manage storage resources effectively. It provides a unified platform for tracking storage performance, optimizing capacity, and ensuring the availability of critical data. This article explores how SolarWinds SRM can become your trusted ally in the world of storage resource management.
Understanding Storage Resource Monitoring
Storage resource monitoring involves the continuous observation and analysis of storage systems to ensure they operate optimally. SolarWinds SRM takes this concept to the next level by offering real-time insights into your storage infrastructure. By understanding the performance and capacity of your storage resources, you can make informed decisions to keep your IT environment running smoothly.
Key Features of SolarWinds SRM
Real-time Storage Monitoring
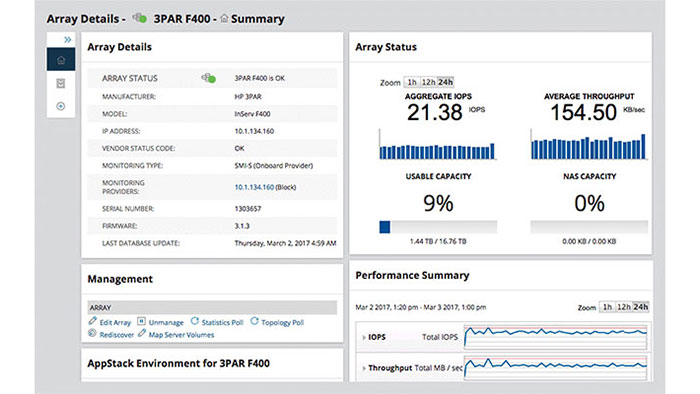
SolarWinds SRM provides real-time visibility into your storage devices, enabling you to keep a constant watch on their health and performance. You can instantly identify bottlenecks, resource overloads, or potential issues before they impact your operations.
Performance Analysis and Optimization
One of SRM’s standout features is its ability to analyze storage performance data comprehensively. It not only identifies issues but also offers optimization recommendations. By fine-tuning your storage configurations, you can ensure peak performance and resource utilization.
Capacity Planning
Efficient capacity planning is essential to prevent storage shortages or excess capacity that leads to unnecessary expenses. SolarWinds SRM helps you forecast future storage needs based on historical data, ensuring you’re always prepared without overspending.
Storage Device Support
The licensed SolarWinds SRM is compatible with a wide range of storage devices, including SANs, NAS, and cloud-based storage solutions. This flexibility makes it suitable for diverse IT environments.
Alerting and Notifications
SRM keeps you in the loop by providing customizable alerts and notifications. Set thresholds for various metrics, and receive instant alerts when something goes awry. This proactive approach to monitoring allows you to address issues swiftly.
Benefits of Using SolarWinds SRM
Improved Storage Efficiency
By continuously monitoring storage resources and optimizing their usage, SolarWinds SRM improves storage efficiency. This means you can get more out of your existing infrastructure without the need for constant upgrades.
Reduced Downtime and Risk
Downtime and data loss are costly in both financial and reputational terms. SRM’s real-time monitoring and alerting help you identify and mitigate potential issues, reducing the risk of unplanned outages.
Cost Savings
Through optimized resource utilization and better capacity planning, SolarWinds SRM can lead to substantial cost savings. You’ll spend less on unnecessary hardware and maintenance.
Enhanced Decision-Making
Data-driven decision-making is at the core of modern IT management. With SRM’s comprehensive performance and capacity data, you can make informed choices about your storage infrastructure.
Use Cases of SolarWinds SRM
Enterprise Data Centers
Large-scale data centers rely heavily on efficient storage management. SRM ensures that these critical facilities operate smoothly by providing real-time insights into storage performance and capacity.
Cloud Storage Environments
Many organizations leverage cloud storage for its scalability and flexibility. SRM extends its monitoring capabilities to the cloud, giving you a unified view of your entire storage ecosystem.
Virtualized Infrastructure
Virtualization has transformed IT, but it also places unique demands on storage resources. SRM helps you manage these resources effectively, ensuring virtualized environments perform optimally.
Storage Consolidation Projects
When consolidating storage resources, it’s crucial to understand how to allocate them efficiently. SRM provides the necessary visibility to consolidate without sacrificing performance or reliability.
Implementing SolarWinds SRM
To leverage the power of SolarWinds SRM, you need a structured implementation approach.
System Requirements
Ensure your infrastructure meets SRM’s system requirements, including hardware specifications and compatible operating systems.
Installation Process
Follow the step-by-step installation guide provided by SolarWinds to set up SRM in your environment.
Configuration and Integration
Customize SRM to align with your specific monitoring needs and integrate it with other SolarWinds products or third-party tools for a holistic IT management solution.
Monitoring and Managing Storage Resources
Once SRM is up and running, it’s time to dive into the core tasks of monitoring and managing your storage resources.
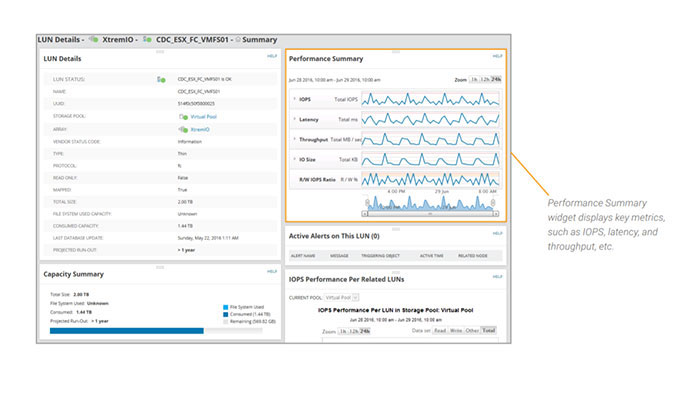
Performance Metrics
Monitor key performance metrics like IOPS (Input/Output Operations Per Second), latency, and throughput to ensure optimal storage performance.
Capacity Analysis
Regularly analyze storage capacity data to identify trends and anticipate storage needs before they become critical.
Storage Allocation
Allocate storage resources efficiently to prevent over-provisioning or resource scarcity, striking the right balance between performance and cost.
Optimizing Storage Infrastructure
Storage optimization is an ongoing process that ensures you get the most out of your investments.
Identifying Bottlenecks
Use SRM’s licensed performance analysis tools to pinpoint bottlenecks and address them promptly.
Predictive Analysis
Leverage historical data to predict future storage requirements accurately, preventing capacity-related issues.
Load Balancing
Distribute storage workloads evenly across available resources to maintain consistent performance and prevent overloading.
Alerting and Notifications
Configure SRM’s licensed alerting system to receive real-time notifications about critical storage issues.
Setting Up Alerts
Define alert thresholds based on your organization’s specific requirements and priorities.
Customizing Notifications
Tailor notifications to the right personnel or teams, ensuring swift response to storage incidents.
Incident Response
Use SRM’s alerting system to trigger incident response processes, minimizing downtime and data loss.
Licensing Options for SolarWinds SRM
The licensed SolarWinds offers various licensing options to accommodate different organization sizes and needs.
Free Trial
Explore SRM’s capabilities with a free trial to determine if it’s the right fit for your organization.
Licensing Tiers
Choose from different licensing tiers based on the number of storage resources you need to monitor and manage.
Scalability
SolarWinds SRM scales with your organization, allowing you to add more storage resources as your needs grow.
Comparing SolarWinds SRM with Alternatives
To make an informed decision, consider how SRM compares with other storage monitoring solutions in the market.
Pros and Cons
Examine the strengths and weaknesses of SolarWinds SRM relative to its competitors.
Unique Selling Points
Identify what sets SRM apart, such as its comprehensive feature set and user-friendly interface.
How SolarWinds Storage Resource Monitoring helps organizations?
SolarWinds Storage Resource Monitoring (SRM) plays a pivotal role in helping organizations in various ways. Here’s an in-depth look at how SRM benefits organizations:
Improved Storage Efficiency
The licensed SolarWinds SRM continuously monitors storage resources and provides real-time insights into their performance and capacity. By optimizing storage usage and identifying inefficiencies, SRM ensures that organizations get the most out of their existing infrastructure. This efficiency leads to cost savings and better resource utilization.
Reduced Downtime and Risk Mitigation
Downtime can be catastrophic for organizations, resulting in financial losses and reputational damage. SRM’s real-time monitoring and alerting capabilities enable IT teams to identify potential issues early, minimizing the risk of unplanned outages. This proactive approach to monitoring helps organizations maintain high availability and reliability of critical data.
Cost Savings
Efficient storage management is cost-effective. By optimizing resource allocation, reducing over-provisioning, and preventing resource shortages, SRM helps organizations save on hardware, maintenance, and operational costs. It provides a clear view of where investments are needed and where they can be scaled back.
Enhanced Decision-Making
Informed decision-making is essential for effective IT management. SolarWinds SRM equips organizations with comprehensive performance and capacity data. This data empowers IT professionals to make data-driven decisions about storage infrastructure, ensuring that it aligns with business goals and requirements.
Streamlined Compliance and Reporting
Many organizations need to adhere to regulatory requirements that mandate data storage and security standards. The licensed SolarWinds SRM simplifies compliance by providing detailed reporting and auditing capabilities. It assists organizations in documenting their adherence to compliance standards and facilitates the generation of compliance reports for auditing purposes.
Optimized Resource Allocation
Effective storage management involves allocating resources efficiently. SRM provides visibility into how storage resources are being utilized, enabling IT teams to allocate resources where they are needed most. This ensures that critical applications receive the necessary storage resources without unnecessary over-allocation.
Enhanced Troubleshooting and Performance Analysis
When performance issues occur, SRM helps IT teams quickly identify the root causes. It offers comprehensive performance analysis tools to pinpoint bottlenecks, resource overloads, or other issues affecting storage performance. This streamlined troubleshooting process reduces mean time to resolution (MTTR) and minimizes disruptions.
Capacity Planning
SolarWinds SRM excels at capacity planning. By analyzing historical data and trends, it provides insights into future storage requirements. This proactive approach helps organizations scale their storage infrastructure in anticipation of growth, preventing capacity-related problems.
Unified Monitoring for Diverse Environments
Modern IT environments often consist of a mix of on-premises and cloud-based storage. SRM supports a wide range of storage devices and cloud services, providing a unified view of the entire storage ecosystem. This simplifies management and monitoring for organizations with hybrid or multi-cloud setups.
Customizable Alerts and Notifications
SRM enables organizations to set up custom alerts based on specific performance or capacity thresholds. IT teams receive real-time notifications when these thresholds are breached, allowing them to take immediate action. This ensures that potential issues are addressed before they impact operations.
Scalability and Flexibility
SolarWinds SRM is scalable, allowing organizations to expand their monitoring capabilities as their storage needs grow. Whether an organization is small or large, SRM can adapt to their requirements, making it a flexible solution for a wide range of enterprises.
In summary, SolarWinds Storage Resource Monitoring is a powerful tool that enhances storage efficiency, reduces downtime, saves costs, and empowers organizations to make data-driven decisions. By implementing SRM, organizations can ensure that their storage resources align with business objectives and operate at peak performance.
Conclusion
In conclusion, SolarWinds SRM is a robust solution for storage resource monitoring and management. Its comprehensive feature set, real-time monitoring capabilities, and scalability make it an invaluable tool for IT professionals across various industries. By implementing SRM, organizations can enhance storage efficiency, reduce downtime, save costs, and make informed decisions to drive their IT infrastructure forward.