For a business to succeed, its network must be strong. Because of this increased reliance on networks by businesses, even the smallest network outages can be detrimental to your company. Therefore, it is the responsibility of the network administrators to ensure that they identify network issues and fix them before they worsen. Which, even for the most skilled professional, is not a simple task. Unless, of course, you’re employing a dedicated Network Performance Monitor.
See, the majority of the tasks that network engineers must perform manually can be automated using a variety of networking tools. There are many names that come to mind, but the licensed Solarwinds Log and Network Performance Pack which includes the licensed SolarWinds Network Performance Monitor (NPM) is the best.

The reasons for this will be covered as we go along with the review, but to put it briefly, this NPM is the ideal blend of feature set and price. The tool gives you total network visibility, including endpoints and servers, as well as a centralized method of managing them. I don’t know about you, but spending my morning opening separate SSH or Telnet sessions for each switch on my network is not how I want to spend it.
The licensed SolarWinds NPM has been preconfigured to gather crucial performance data from your network’s components, monitor their health, and carry out deep packet inspection and analysis. All of which will significantly lessen network downtime.
Offering Multi-Vendor Support is SolarWinds NPM
To poll the performance data, this tool uses the SNMP, ICMP, and WMI protocols that are built into almost all networking devices. Consequently, you ought to be able to monitor all of your hosts regardless of the underlying Operating System. Included in this are those in your virtual environment. However, the NPM can only be set up in a Windows environment.
Solarwinds Log and Network Performance Pack Key features
The licensed SolarWinds Network Performance Monitor is a main software in this app, in the following we will introduce some of the main features of this licensed software:
Wireless surveillance
An integrated Wireless Poller in the licensed SolarWinds Network Performance Monitor automatically detects wireless devices, including those that are being managed in the cloud. Additionally, it provides you with device details like the client name, IP address, Mac address, and an Rx/Rt summary. Additionally, it polls crucial performance information, including bandwidth usage, node status at the moment, typical response time, packet loss, and network strength. The timing of decisions like when to add new switches and Wi-Fi boosters will depend on how to set up your router to get the strongest signal possible.
As if that weren’t enough, the Wi-Fi analyzer tool also enables you to generate reports for various aspects of your wireless hosts, including availability, average and peak client counts, as well as the detection of rogue access points over a predetermined period. The latter is a strong security feature that can keep hackers out of your network. You can also configure alerts for the wireless hosts using the wireless monitoring module.
Reporting
With the help of the network reporting tools and the sophisticated reporting engine included with the licensed SolarWinds NPM, you can build detailed performance reports for your devices. The tool offers a number of pre-built report templates that you can use, and it also enables you to import unique reports that users of Thwack, SolarWind’s online community, have created. Using SQL commands, you can even start from scratch when creating your reports. In relation to that, do you find the thought of being a part of a group of people who share your interests appealing? Here, you can network with other network administrators as they discuss how to get the most out of the NPM and their own experiences using it.
The reports produced will be helpful in a number of situations, such as demonstrating compliance with Service Level Agreements and forecasting future network capacity requirements by examining current trends. When you want to communicate the performance situation of your business network, you can also present them to the management team.
Notices of Alerts
I’ve already mentioned the NPM’s automatic alerting capabilities, but just to elaborate, this tool supports a variety of alerting techniques. The first is through the alerts dashboard on the software’s summary page. Email and SMS alerts are then additional methods.
The preset baseline conditions for different components can be modified to prevent erroneous alerts. More importantly, the licensed SolarWinds Network Performance Monitor (NPM) enables you to create dependencies between various events so that if one of them happens, no alert is triggered, but if multiple of them happen, you are alerted.
To resolve a network issue without having to be physically present, you can configure the NPM to run an external program whenever an alert is triggered.
The SolarWinds NPM can be used to receive SNMP traps in addition to condition-based alerts, which look at the key metrics to spot deviations from expected performance. These are alert messages that are sent directly from SNMP-enabled devices and are a sign of problems like device overheating.
Analyzing NetPath
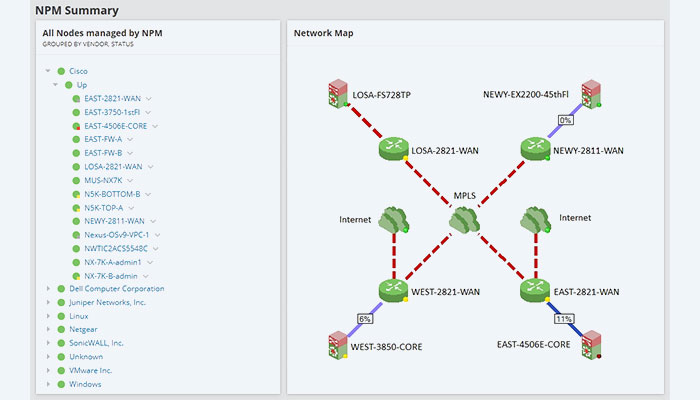
Another useful NPM feature that lets you follow the network data hop by hop is called NetPath. You can actually see how the data is being transmitted when this feature is used in conjunction with a network topology map, which makes troubleshooting go more quickly. You can track connections between the end user and the services they are requesting to find out what is causing the latency problems. For on-premises, hybrid, and cloud environments, NetPath can be used.
Performance evaluation
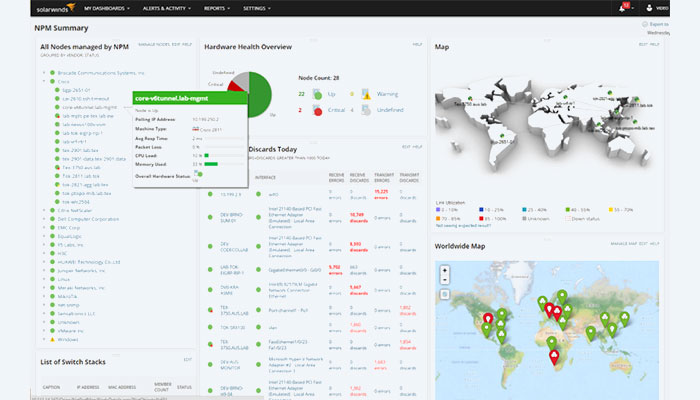
Individual dashboards on the NPM interface show the performance data gathered from your network components. You also don’t need to spend your entire day staring at the monitor looking for anomalies. The current data will be compared by NPM against pre-configured threshold conditions. Additionally, it will send alerts in the event of a deviation so that you can take appropriate action. Additionally, color-coding is used to show how different network components are doing. Green denotes success, Yellow indicates a need for action, and Red denotes a serious situation.
Additionally, the tool produces graphic visualizations of the data so that network problems can be more easily seen. You can drag and drop performance reports to make it even better and arrange them side by side for simpler comparison. When contrasting a host’s historical data with its current data, this will be especially helpful. Or it can help if you have two similar devices and one of them starts to have problems.
Installation
There are two ways to install the licensed SolarWinds Network Performance Monitor (NPM). Installing online is the first and best method. Only the 50MB online installer is required here; the other parts required to run NPM will be downloaded during installation. The benefit of this approach is that you only download what you require while receiving the most recent product optimizations and fixes. Of course, for this to function, the Orion server needs to have internet access. The alternative method, known as offline installation, entails downloading a 2GB installer that already contains all the required files.
Additionally, there are two ways that SolarWinds Network Performance Monitor (NPM) can be installed. The first option is the Lightweight installation, which is ideal for testing a product or keeping an eye on a small network. In this configuration, both the application server and the SQL database server are installed on the same machine. Due to the unhealthy hardware resource competition that would arise between Orion and SQL, this would not be practical in a production environment.
Additionally, the database will only be able to store up to 10GB of data. We use the Standalone deployment method for this reason. In this case, enterprise monitoring will work perfectly because the NPM application server and SQL database are on separate servers.
