
Splunk Application Performance Monitoring (APM) helps teams understand how their applications behave in real time, so they can quickly spot issues, fix bottlenecks, and keep things running smoothly.
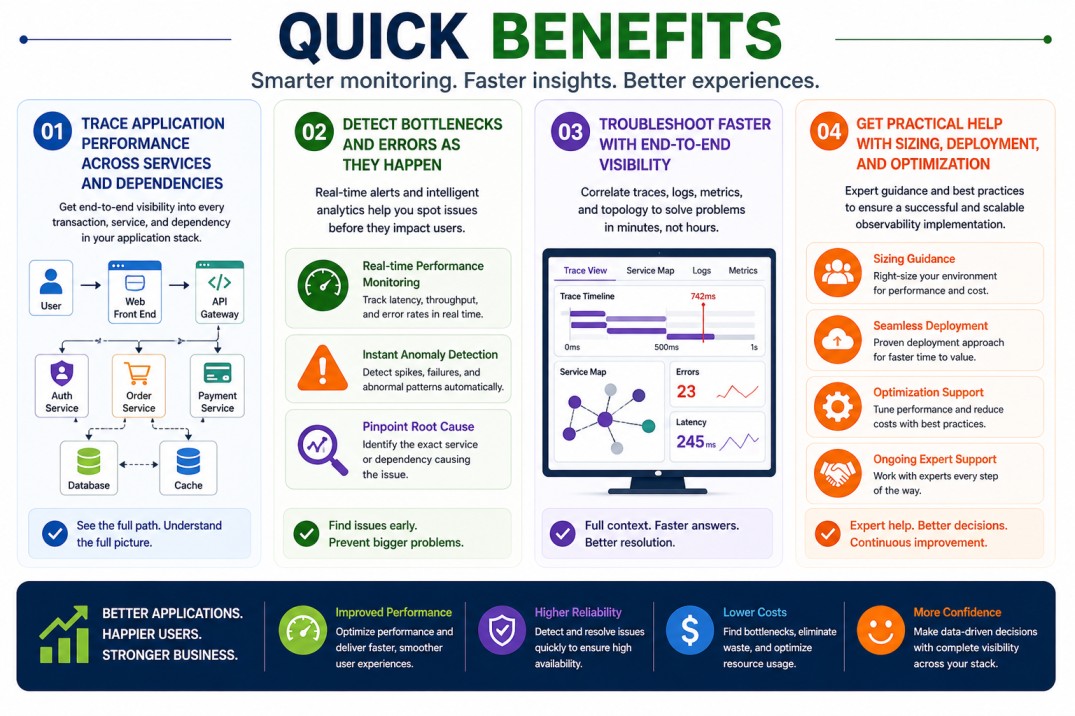
Quick benefits
- Trace application performance across services and dependencies
- Detect bottlenecks and errors as they happen
- Troubleshoot faster with end-to-end visibility
- Get practical help with sizing, deployment, and optimization
Splunk Application Performance Monitoring (APM) At a glance
What it does : Splunk Application Performance Monitoring (APM) tracks how requests move across services, giving you a clear view of performance and dependencies.
License type : Subscription-based (usage-driven)
Typical term : 1 year · 3 years · 5 years
Activation method : Cloud-based activation with application instrumentation and platform integration
Who needs it : DevOps teams, SREs, and engineering teams responsible for application performance and reliability

License Overview
The Splunk Application Performance Monitoring license gives you access to APM capabilities within the Splunk Observability platform. Unlike traditional monitoring tools that focus on fixed metrics, Splunk APM is typically licensed based on usage, such as the number of hosts, the volume of traces, or the overall workload being monitored. In real environments, this means your license should reflect how your applications are built and how much telemetry data they generate. As systems move toward microservices and distributed architectures, the number of traces and monitored components can grow quickly, which directly affects licensing requirements.
Activation is usually handled by instrumenting your applications with agents or SDKs and connecting them to the Splunk platform. Once everything is in place, the system begins collecting trace data, measuring latency, and highlighting performance issues across services. Because Splunk Application Performance Monitoring is often used in fast-changing environments, getting the sizing right is important. Too little capacity can limit visibility, while too much may increase costs unnecessarily. A balanced approach helps maintain consistent monitoring while allowing your environment to scale over time.
Product Overview
Splunk Application Performance Monitoring (APM) is built to give teams a clear picture of how their applications actually behave. Instead of looking at individual services separately, it follows requests as they move through the entire system.
In practice, this is especially useful in microservices environments, where a single request may pass through several services before completing. Splunk APM shows that full path, making it easier to see where delays or errors are happening.
Another advantage is real-time visibility. You don’t have to wait for logs or reports, performance issues show up as they happen, which makes troubleshooting much faster.
As applications become more distributed, this kind of insight becomes essential. Splunk APM helps teams keep performance under control without needing to rely on multiple disconnected tools.
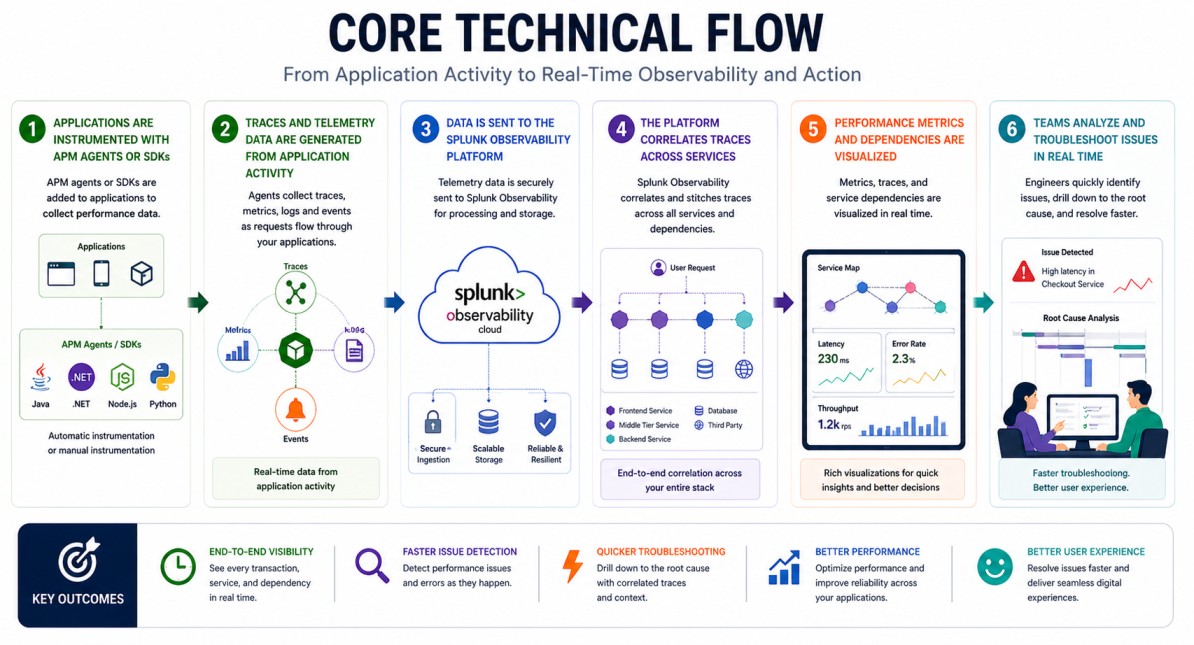
Core technical flow
- Applications are instrumented with APM agents or SDKs
- Traces and telemetry data are generated from application activity
- Data is sent to the Splunk Observability platform
- The platform correlates traces across services
- Performance metrics and dependencies are visualized
- Teams analyze and troubleshoot issues in real time
Options & Tiers
| Plan / Model | Best for | Key inclusions | What affects price |
|---|---|---|---|
| Splunk APM standard | Most application teams | Distributed tracing + monitoring | Host count, trace volume, term |
| APM + Observability Suite | Full observability needs | Metrics, logs, and traces together | Data scope, integrations |
| Cloud-native deployment | Microservices environments | Real-time tracing and scaling | Usage, environment size |
| Enterprise-scale deployment | Large environments | High-volume tracing and analytics | Architecture complexity |
Features & Benefits
Splunk Application Performance Monitoring makes it easier to understand what’s happening inside your applications without jumping between tools. By tracing requests across services, it helps you quickly identify where performance issues are coming from. One of the biggest advantages is faster troubleshooting. Instead of guessing, teams can see exactly which part of the system is causing a delay or failure. This helps reduce downtime and improves overall reliability. It also works well in modern environments. Whether you’re running microservices or distributed systems, Splunk APM can scale alongside your architecture and continue providing consistent visibility as things grow.
Compatibility & Requirements
Common environments
- Microservices and cloud-native applications
- DevOps and SRE-driven organizations
- Distributed application architectures
Typical prerequisites
- Application instrumentation (agents or SDKs)
- Access to telemetry data
- Integration with Splunk Observability platform
How activation works
- Deploy APM agents or SDKs across your applications
- Connect applications to the Splunk Observability platform
- Apply the license entitlement
- Start collecting trace and performance data
- Monitor and optimize based on insights
Pricing factors + quote process
Splunk Application Performance Monitoring pricing depends on how your applications are structured and how much telemetry data they generate. Host count, trace volume, and the number of monitored services all play a role in determining the right capacity. The complexity of your environment also matters. More distributed systems usually generate more data, which can increase usage. Subscription length can influence pricing as well, with longer terms often offering better value. The most accurate pricing comes from matching the solution to your actual application environment rather than relying on rough estimates.
After you request a quote
- We review your application architecture and usage
- Recommend the most suitable deployment model
- Provide official pricing and delivery details
- Share clear activation and optimization guidance
Splunk Pricing depends on your license edition, quantity, term, and deployment needs.