
Splunk Infrastructure Monitoring (IM) helps teams keep a close eye on infrastructure performance in real time, so issues can be spotted early and systems stay stable as environments grow.
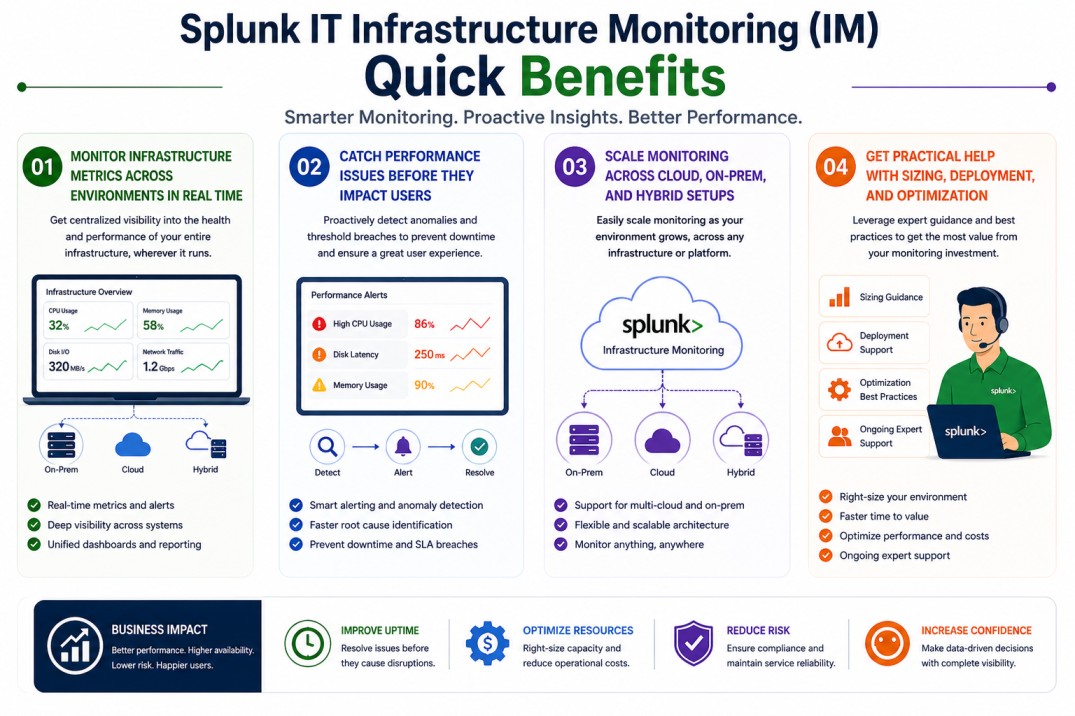
Quick benefits
- Monitor infrastructure metrics across environments in real time
- Catch performance issues before they impact users
- Scale monitoring across cloud, on-prem, and hybrid setups
- Get practical help with sizing, deployment, and optimization
Splunk Infrastructure Monitoring (IM) At a glance
What it does : Splunk Infrastructure Monitoring (IM) collects and analyzes metrics from infrastructure systems to provide real-time visibility and alerting.
License type : Subscription-based (usage-driven)
Typical term : 1 year · 3 years · 5 years
Activation method : Cloud-based platform with agent-based or integration-based data collection
Who needs it : IT operations teams, DevOps engineers, and SREs managing infrastructure across cloud, on-prem, or hybrid environments

License Overview
The Splunk Infrastructure Monitoring license gives you access to real-time infrastructure monitoring within the Splunk Observability platform. Instead of relying on periodic checks or delayed data, Splunk IM continuously collects metrics so you can see what’s happening as it happens. In real environments, licensing is usually based on usage, things like how many hosts you’re monitoring, how much metric data is being collected, and how frequently that data is sent. As environments grow, especially in cloud-native or container-based setups, the number of monitored components can increase quickly, which is why proper sizing matters.
Getting started is straightforward. Once your systems are connected to the platform, either through agents or integrations, and the license is applied, metrics begin flowing in. From there, the platform processes the data and makes it available through dashboards and alerts. Because Splunk Infrastructure Monitoring is often used in fast-changing environments, having the right license size helps maintain consistent visibility. Too little capacity can mean missing important signals, while too much can lead to unnecessary cost. A balanced setup keeps monitoring reliable as your infrastructure evolves.
Product Overview
Splunk Infrastructure Monitoring (IM) is designed to give teams a clear, real-time view of how their infrastructure is performing. Instead of waiting for logs or user complaints, you can see system behavior directly through live metrics.
In practice, this means collecting data from servers, containers, cloud services, and other infrastructure components, then visualizing it in a way that’s easy to understand. Trends, spikes, and unusual patterns become much more visible.
One of the main advantages is how well it handles scale. Whether you’re monitoring a small setup or a large, distributed environment, Splunk IM is built to process high volumes of data without losing visibility.
As infrastructure becomes more dynamic, having immediate insight into performance helps teams stay ahead of problems rather than reacting after the fact.
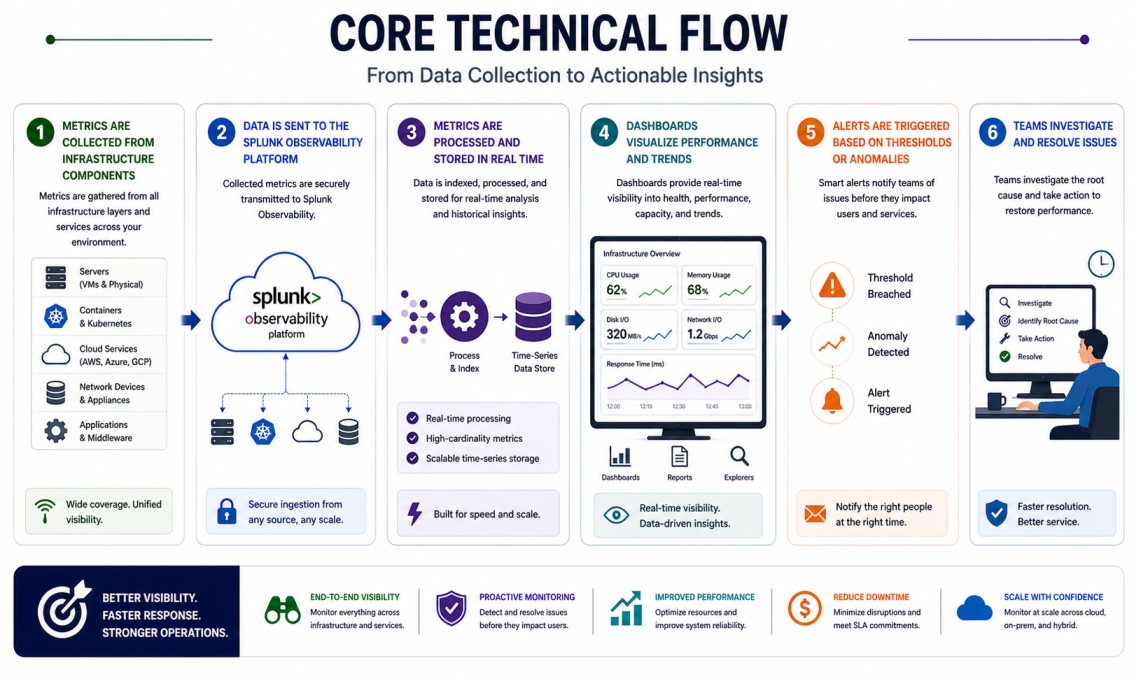
Core technical flow
- Metrics are collected from infrastructure components (servers, containers, cloud services)
- Data is sent to the Splunk Observability platform
- Metrics are processed and stored in real time
- Dashboards visualize performance and trends
- Alerts are triggered based on thresholds or anomalies
- Teams investigate and resolve issues
Options & Tiers
| Plan / Model | Best for | Key inclusions | What affects price |
|---|---|---|---|
| Splunk IM standard | Most infrastructure teams | Real-time metrics + alerting | Host count, metric volume, term |
| IM + Observability Suite | Full visibility needs | Metrics, logs, and traces combined | Data scope, integrations |
| Cloud-native monitoring | Dynamic environments | Container and cloud metrics | Usage, environment size |
| Enterprise-scale deployment | Large infrastructures | High-volume metric processing | Architecture complexity |
Features & Benefits
Splunk Infrastructure Monitoring helps teams stay on top of performance by providing continuous visibility into infrastructure metrics. Instead of relying on delayed data, teams can see what’s happening in real time and respond more quickly. One of the key benefits is early detection. By identifying unusual behavior or performance drops as they occur, teams can address issues before they impact users. It also adapts well to modern environments. Whether you’re working with cloud-native applications, containers, or traditional systems, Splunk IM scales alongside your infrastructure and keeps monitoring consistent.
Compatibility & Requirements
Common environments
- Cloud and hybrid infrastructures
- Containerized and microservices environments
- Traditional data center setups
Typical prerequisites
- Access to infrastructure metrics
- Integration with relevant systems
- Network connectivity to the platform
How activation works
- Connect your infrastructure to the Splunk platform
- Deploy agents or configure integrations
- Apply the license entitlement
- Start collecting and visualizing metrics
- Configure alerts and dashboards
Pricing factors + quote process
Splunk Infrastructure Monitoring pricing depends mainly on how much of your infrastructure you’re monitoring and how much data is being generated. The number of hosts, the volume of metrics, and how frequently data is collected all influence the overall cost.
The type of environment also plays a role. More dynamic setups, like cloud-native or containerized environments, tend to generate more data, which can increase usage. Subscription length can also affect pricing, with longer terms often offering better value.
The most accurate pricing comes from aligning the solution with your actual infrastructure rather than relying on rough estimates.
After you request a quote
- We review your infrastructure scope and usage
- Recommend the most suitable deployment approach
- Provide official pricing and delivery details
- Share clear activation and optimization guidance
Splunk Pricing depends on your license edition, quantity, term, and deployment needs.