
Splunk Real User Monitoring (RUM) helps teams understand how users actually experience their applications, so they can quickly spot issues and improve performance where it matters most.
Quick benefits
- See application performance from the real user perspective
- Detect frontend issues like slow load times and errors
- Troubleshoot faster using real session data
- Get practical help with sizing, deployment, and optimization

Splunk Real User Monitoring (RUM) At a glance
What it does : Splunk Real User Monitoring (RUM) captures user interactions in real time to provide insight into frontend performance and overall user experience.
License type : Subscription-based (usage-driven)
Typical term : 1 year · 3 years · 5 years
Activation method : Cloud-based platform with browser instrumentation
Who needs it : Frontend developers, DevOps teams, and organizations focused on improving application performance and user experience
License Overview
The Splunk Real User Monitoring license gives you visibility into how users interact with your application in real time. Instead of relying only on backend metrics, Splunk RUM focuses on what actually happens in the browser—things like load times, errors, and user actions. In practice, licensing is usually tied to usage, such as the number of sessions, page views, or events being captured. As your traffic grows, the amount of data collected increases as well, which directly affects how the solution should be sized.
Getting started is simple. After adding a lightweight script to your application and connecting it to the Splunk platform, data begins flowing in almost immediately. From there, you can start analyzing user behavior and performance trends. Because Splunk Real User Monitoring is often used in high-traffic environments, getting the sizing right is important. Too little capacity can limit visibility into user experience, while too much can increase costs unnecessarily. A balanced setup helps maintain consistent insight as usage grows.
Product Overview
Splunk Real User Monitoring (RUM) is designed to show what your users are actually experiencing when they interact with your application. Instead of relying on backend data alone, it captures real activity directly from the browser.
In real environments, this means you can see how long pages take to load, where errors occur, and how users interact with different parts of your application. This makes it much easier to understand where problems are happening and how they affect users.
One of the main advantages is how it connects frontend and backend visibility. When combined with tools like APM, it helps trace issues from the user interface all the way back to the underlying services.
As traffic increases and applications become more complex, this kind of insight helps teams maintain a consistent and reliable user experience.
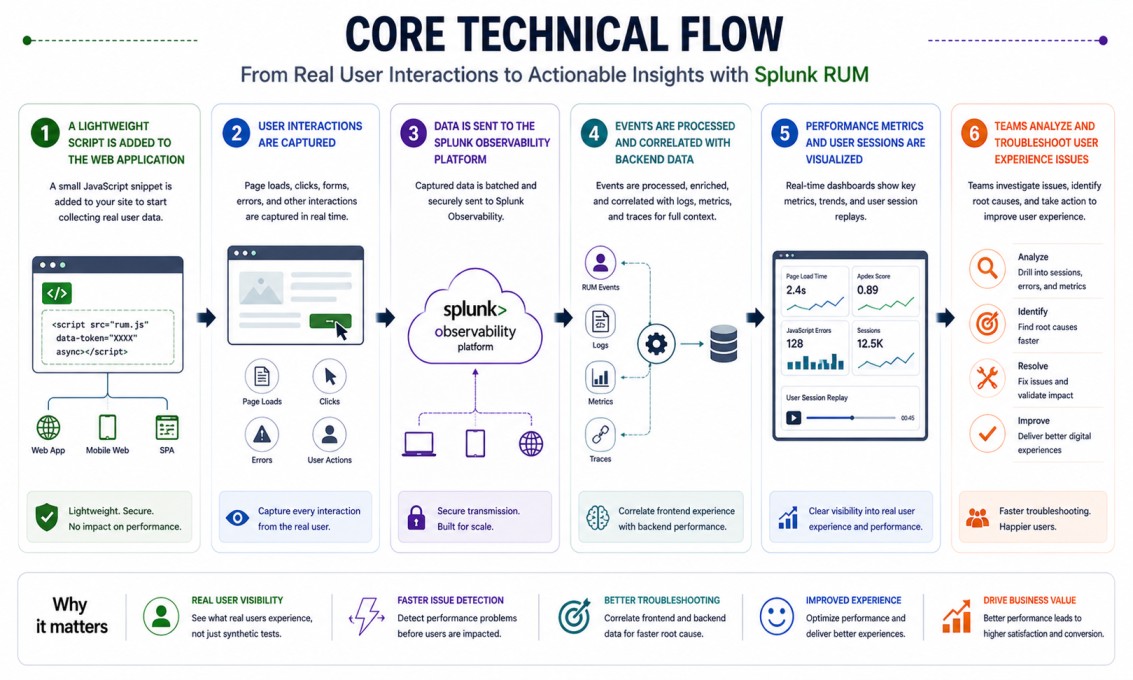
Core technical flow
- A lightweight script is added to the web application
- User interactions (page loads, clicks, errors) are captured
- Data is sent to the Splunk Observability platform
- Events are processed and correlated with backend data
- Performance metrics and user sessions are visualized
- Teams analyze and troubleshoot user experience issues
Options & Tiers
| Plan / Model | Best for | Key inclusions | What affects price |
|---|---|---|---|
| Splunk RUM standard | Most web applications | Real user monitoring + session data | Session volume, term |
| RUM + APM integration | Full visibility | Frontend + backend correlation | Data scope, integrations |
| High-traffic deployment | Large applications | Scalable monitoring | Usage scale |
| Enterprise deployment | Complex environments | Advanced analytics and insights | Architecture complexity |
Features & Benefits
Splunk Real User Monitoring helps teams understand performance from the user’s perspective, not just from system metrics. This makes it easier to identify issues that directly affect user experience. One of the key benefits is faster troubleshooting. When something goes wrong, you can see exactly where the issue is happening and how it impacts users, which speeds up resolution. It also supports ongoing improvement. By highlighting slow pages, errors, and interaction delays, teams can make targeted changes that improve the overall experience.
Compatibility & Requirements
Common environments
- Web applications and frontends
- Cloud-native and microservices environments
- High-traffic digital platforms
Typical prerequisites
- Ability to add browser instrumentation
- Access to frontend code
- Integration with Splunk Observability platform
How activation works
- Add the Splunk RUM script to your application
- Connect the application to the Splunk platform
- Apply the license entitlement
- Start collecting user interaction data
- Analyze and improve user experience
Pricing factors + quote process
Splunk Real User Monitoring pricing is mainly based on how much user activity is being captured. This includes the number of sessions, page views, and frontend events generated by your application. High-traffic environments typically require more capacity, while smaller applications need less. Integration with other tools, such as APM, can also affect the overall setup.
Subscription length plays a role as well, with longer terms often offering better value. The most accurate pricing comes from aligning the solution with your actual traffic and usage rather than relying on rough estimates.
After you request a quote
- We review your traffic and application setup
- Recommend the most suitable deployment approach
- Provide official pricing and delivery details
- Share clear activation and optimization guidance
Splunk Pricing depends on your license edition, quantity, term, and deployment needs.