
For DevOps, developers, site reliability engineers, and other technical leads, the licensed SolarWinds AppOptics is a seamless platform for monitoring infrastructure and application performance. With over 150 integrations and custom metrics for streamlined dashboarding, analytics, and alerting pipelines, the solution is built for both cloud native and hybrid environments. Users can detect performance issues before their customers do thanks to the licensed SolarWinds AppOptics comprehensive visibility into their applications and infrastructure.

Solarwinds AppOptics Review
To aid in the optimization of IT infrastructure and server performance, AppOptics gives users a bird’s-eye view of all hosts. Monitoring tools display server, infrastructure, and APM metrics side by side on a single dashboard for easy cross-referencing, and multidimensional filtering aids in the identification of hot spots and outliers. Customizable and updated automatically in real time as servers and infrastructure are added or removed, AppOptics elastic dashboards are available in a variety of formats. Users can easily share dashboards with other team members and create custom alert notifications, document events, and overlay them. Users can receive data directly from the source thanks to integrations that are cloud-ready, such as the CloudWatch integration that powers numerous AWS services.
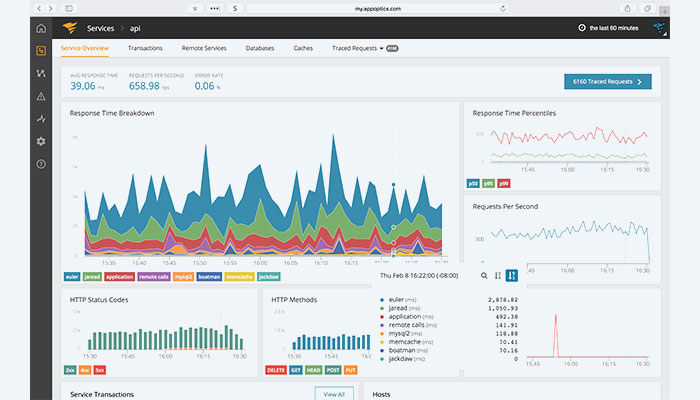
AppOptics is a comprehensive APM tool that brings together application and infrastructure monitoring into common dashboards. Monitoring infrastructure and application metrics in parallel reduces the time it takes to determine which part of the stack is failing, so you can quickly get to the root cause.
The licensed SolarWinds AppOptics features for application performance monitoring, including end-to-end metrics and traces, enable users to visualize and troubleshoot application bottlenecks to help with quick problem-solving. Users can inspect and debug performance, understand the impact of services on resources across N tiers, and monitor the behavior of individual requests in real-time using distributed transaction tracing. Users of heat maps can isolate outliers and trends to identify the underlying causes of issues. Users of the licensed SolarWinds AppOptics can also keep an eye on how well applications run on a variety of different programming languages and frameworks.
SolarWinds AppOptics key features
A proactive monitoring and alerting strategy is essential.
Time can be your enemy when there are problems depending on how many critical applications are running on your servers, hosts, and containers. What part of the infrastructure is malfunctioning, and what should be done to fix it, must be determined quickly. It is crucial to have a tool that lets you view your AWS, Azure, and other platforms in one location, giving you a visual representation of their overall health and enabling quick, thorough drill-down into each infrastructure component. With the help of the licensed SolarWinds AppOptics host and container heatmaps, detailed host views, and proactive, intelligent alerting, you are always the first to learn when the security of your infrastructure is jeopardized.
Azure migration from Microsoft on-premises.
IT professionals tasked with maintaining their infrastructures up and running before, during, and after the transition will find it challenging as a large number of businesses migrate their Microsoft on-premises environments to 100% Azure-based or some hybrid combination. You can support both your Azure-based infrastructure and the Microsoft technology stack you currently use with the licensed SolarWinds AppOptics. No matter where they are being used, you can simultaneously monitor both your .Net applications and critical Azure infrastructure services like virtual machines, storage, Key Vaults, load balancers, Redis, Cosmos DB, SQL databases, and more. You get all of this with easy-to-implement metrics that come with dashboards that are already filled with data.
Easy-to-adapt monitoring that keeps up with the changes in your infrastructure.
The IT infrastructure of today is very different from that of five or even one year ago. The infrastructure of today is ever-changing. Your infrastructure and the applications that run on it can change daily with virtualization, the cloud, automation, and continuous delivery. Your infrastructure monitoring solution must provide you with visibility into all facets and varieties of implementations.
Use host and container maps to visualize your entire infrastructure on a single screen.
Independent of IT implementation, the licensed SolarWinds AppOptics infrastructure keeps an eye on everything and grows with you.
- Easily implement from small to large enterprise IT environments.
- With multidimensional filtering, you can easily spot hotspots and outliers.
- Visualize hosts and containers that have surpassed or are close to utilization and performance thresholds and get a bird’s-eye view of all of your hosts in one window.
- There are more than 150 pre-built integrations and plugins, including numerous infrastructure services from Amazon AWS and Microsoft Azure, including load balancing, web servers, network, and database performance tuning.
With host detail views, explore the infrastructure.
- Views of the performance and usage of hosts holistically.
- To make your own infrastructure dashboards, simply click.
- Drill down into logs connected to a host with a single click.
- Look deeper into system metrics across hosts, servers, and containers.
- View time-series information for processes that are active on the host.
- Show the host’s active services, their response times, and trace requests.
- Drill down and show more time-series metrics after visualizing the fundamental CPU, memory, disk, and network metrics.
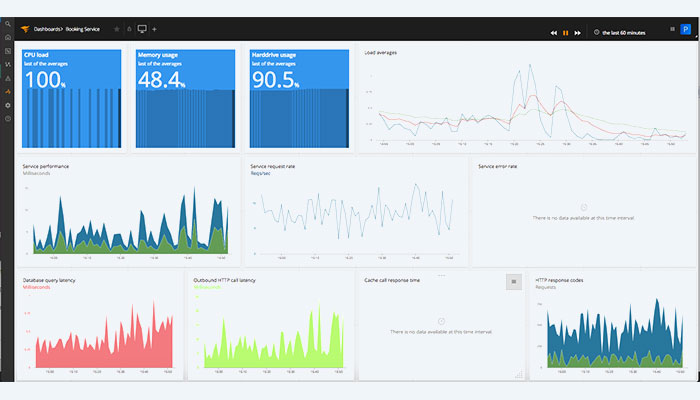
Interactive dashboards provide real-time visibility across your infrastructure.
Utilize or modify AppOptics interactive real-time dashboards, which are updated as you add or remove hosts, servers, containers, and infrastructure. Dashboarding is amazingly simple, effective, and flexible.
- Pre-filled dashboards for well-known systems.
- Infrastructure, human events, and document and overlay applications.
- Without needing to create new accounts, groups can share dashboards.
- Charts and dashboards based on system data can be easily and effectively edited.
- Make alert notifications with vertical markers that you can superimpose on graphs to show alerts from cron-job runs, code deployments, and more.
Receive pre-built, cloud-ready integrations.
The licensed SolarWinds AppOptics integrations enable you to obtain data directly from the source, whether it be on-premises, in the cloud, or in a hybrid environment.
- Respond to the data in real-time visual visualization, alert and action.
- Dozens of AWS infrastructure services are covered by CloudWatch integration.
- Connected automatically to your other infrastructure, application, and custom metrics tools.
- Virtual networks, Key Vaults, Redis, app services, load balancers, Cosmos DB, and more are just a few of the infrastructure services offered by Azure.
Observe the condition of the contemporary infrastructures.
- You can manage all of your hosts, servers, and containers at once with the help of AppOptics.
- CPU, RAM, disk input/output, and network traffic are among the metrics for containers and pods.
- Setup is quick and simple with pre-configured metrics and dashboards for Docker and Kubernetes.
- You can control containers on various hosts using orchestrators. The most widely used orchestrator in use today, Kubernetes, operates by controlling container runtimes that are running on each host.
- The licensed SolarWinds AppOptics can assist you in keeping an eye on and enhancing the health of your IT implementations, whether they are serverless or container-based microservices applications or legacy implementations.
Keep an eye on what matters, easily and cheaply.
- Priced to enable you to keep a closer eye on what matters.
- Infrastructure monitoring that is highly scalable, trustworthy, and secure.
- Immediately get to moving. Start gathering metrics typically within minutes.
- Establish thresholds and proactive alerts to quickly notify you of potential issues.
- For thorough infrastructure resource utilization, drill down into hosts and containers.
- Learn everything there is to know about the condition of your hosts, servers, and containers.